
Inconsistent Results When Operators Change? This Chinese-Made Homogenizer Turns Hands-On Expertise into Standardized Programs
Featured Case Studies
Sep 21, 2026

For many procurement users, choosing a reliable and durable product from among the thousands of instrument brands of mixed quality on the market has always been a headache. To improve users’ selection efficiency and help them buy the “big brand, good instrument, excellent service” they desire, Category Pioneers focuses on highly competitive, fast-growing instrument categories and selects the domestic/imported TOP 5 brands in each sub-category for users.
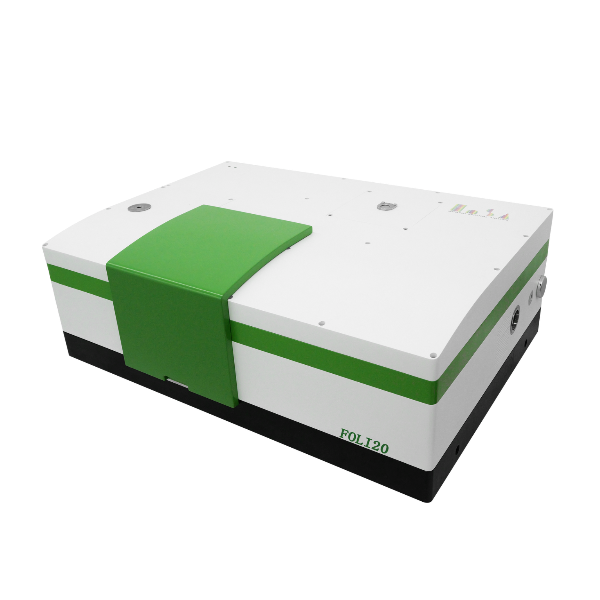
Because Category Pioneers companies have long concentrated on a specific sub-market, continuously honing their production technology or processes, and have withstood the test of long-term use in the daily work of thousands of users, they ultimately rank at the forefront nationwide, or even globally, in single-product market share. Category Pioneers instruments have also earned much praise and usage feedback from users. Today we share the user insights on the INSA Optics INSA FOLI10 FT-IR Spectrometer, a Category Pioneer.
Mid-Infrared Spectroscopy Identifies Waste Plastics — FOLI10 for Rapid Plastic Identification and Chemometric Modeling
Plastic pollution has become one of the most severe environmental problems in the world. Global annual plastic production is currently about 380 million tons, and cumulative production is expected to exceed 30 billion tons by the end of 2050. The recycling and resource recovery of waste plastics is an effective way to reduce plastic pollution and promote a circular economy; and the prerequisite for guaranteeing the quality and economic value of recycled plastics is efficient, accurate and low-cost identification and sorting of waste plastics.
Existing sorting methods (flotation, air separation, electrostatic separation, manual sorting, etc.) rely on the mechanical properties of polymers or require the consumption of large amounts of chemical reagents, and suffer from problems such as secondary pollution, low efficiency and high energy consumption. In contrast, spectral analysis combined with chemometric methods is non-destructive, environmentally friendly and efficient, making it very suitable for the rapid on-site identification of waste plastics. Among these, near-infrared (NIR) spectroscopy technology, although already mature, is strongly absorbed because carbon black is widely used in plastics as a pigment and UV stabilizer, making it difficult to identify dark-colored plastics — yet dark-colored plastics account for a large proportion of waste plastics and often have relatively high recycling value.
Mid-infrared (MIR) spectroscopy is rich in molecular structure information and has a natural advantage in identifying dark-colored plastics. Attenuated total reflection Fourier transform infrared spectroscopy (ATR-FTIR) requires simple sample preparation and can directly analyze solid samples, and has become the mainstream technical route for MIR spectral research on waste plastics. However, most existing studies suffer from problems such as a limited number and variety of samples, uneven spectral quality, and insufficient model robustness to noise, which limit the practical applicability of the models.
This case used the INSA Optics INSA FOLI10 FT-IR spectrometer (equipped with a diamond ATR accessory) to collect the mid-infrared spectra of 698 waste plastic samples of 9 types from 4 sources, and established a systematic MIR spectral database. On this basis, combined with a variational autoencoder (VAE) and simulated noise for data expansion, it systematically evaluated 9 chemometric models, and innovatively combined the discrete wavelet transform (DWT) with discrimination models to achieve high-precision identification of nine types of plastics under complex noise conditions. The study also validated the model performance for the two bands commonly used by hyperspectral cameras — mid-wave infrared (MWIR) and long-wave infrared (LWIR) — providing a basis for the application of mid-infrared hyperspectral imaging (MIR-HSI) in the online sorting of waste plastics.
This experiment mainly used the following instruments and tools:
Among these, the FOLI10 undertook the mid-infrared spectral acquisition task for all samples. The instrument’s detection system is equipped with a high-sensitivity DLaTGS detector, an electronically cooled MCT detector and a liquid-nitrogen-cooled MCT detector; each spectrum was averaged over 16 scans to further improve the signal-to-noise ratio. The ATR accessory requires no complicated sample preparation — a solid plastic sample only needs to make close contact with the surface of the diamond crystal to complete the measurement, making it suitable for the rapid measurement of waste plastic samples in various forms such as films, granules, fragments, fibers and powders.
Figure 1. Waste plastic samples (stored in ziplock bags), the FOLI10 FT-IR spectrometer, and the diamond ATR crystal press tip (indicated by the red circle).
To ensure sample diversity, a total of 698 plastic samples of 9 types were collected, covering various forms such as films, granules, fragments, fibers and powders, as well as various colors such as black, white, transparent, gray, blue, yellow, red, brown, green, pink, purple and so on. The nine types of plastic were: polyethylene (PE), polyamide (PA), polystyrene (PS), polycarbonate (PC), acrylonitrile-butadiene-styrene copolymer (ABS), polyethylene terephthalate (PET), polybutylene terephthalate (PBT), polypropylene (PP) and polyvinyl chloride (PVC) — all common plastics in waste electrical and electronic equipment, construction and demolition waste, and municipal solid waste.
The samples came from 4 different sources: P1 is pure plastic (plastic powder free of any additives, particle size about 106 µm, purchased from Shandong Hongyun New Material Technology Co., Ltd., used as a control baseline for the spectral analysis of waste plastics); P2 is industrial recycled plastic (recycled plastic pellets containing various additives); P3 is household plastic waste (collected in Haidian District, Beijing, with complex composition and containing various additives); and P4 is marine plastic waste (naturally aged plastic fragments collected from the waters of Changdao County, Yantai City, Shandong Province). The types of P1 and P2 are known, while the types of P3 and P4 were determined through plastic recycling marks, manual spectral comparison and library searches on www.openspecy.org.
Figure 2. Distribution of plastic samples of different forms and colors (a), and the quantitative distribution of plastics by type and source (b).
Sample pretreatment: for samples with surface contaminants (such as dust and oil stains), the surface was first wiped with anhydrous ethanol and air-dried at room temperature for about 2 minutes to remove the main contaminants and reduce interfering peaks; for waste plastic films (common thickness about 0.01–0.25 mm), the film was folded into 3–4 layers to enhance the stability of contact with the ATR crystal and improve signal quality. The above simple treatment was verified by experiments to effectively improve spectral quality and meet the needs of qualitative analysis, while avoiding the time cost brought by complicated sample pretreatment.
The mid-infrared spectra of all samples were collected using the FOLI10 spectrometer equipped with a diamond ATR accessory. Before measurement, the surface of the ATR crystal was cleaned with dust-free wiping paper and a background spectrum was collected; during measurement, the sample was placed on the ATR crystal, evenly pressed with the matching press tip and rotated two turns to ensure close contact between the sample and the crystal. One spectrum was collected for each sample. The main test conditions of this experiment were as follows:
| Test Item | Condition |
|---|---|
| Instrument | INSA FOLI10 FT-IR Spectrometer |
| Test accessory | Diamond ATR accessory |
| Scanning range | 4000–550 cm-1 |
| Spectral resolution | 4 cm-1 |
| Number of scans | 16 |
| Data points per spectrum | 8978 |
| Sample state | Solid (film, granule, fragment, fiber, powder, etc.) |
Analysis of the infrared spectra of the nine types of plastics shows that almost all characteristic absorption peaks are concentrated in two bands, 550–1818 cm-1 and 2700–3393 cm-1, so these two bands were selected as the characteristic bands to reduce modeling cost. It should be noted that the C–H stretching vibration absorption peaks of –CH2– and –CH3 (2800–3000 cm-1) fall entirely within the MWIR band range, whereas the LWIR band is narrower and the C=O stretching vibration as well as most C–H bending vibration absorption peaks are excluded, which brings challenges to the subsequent narrow-band modeling.
Figure 3. The 698 plastic mid-infrared spectra in the original spectral dataset DA.
Figure 4. The mid-infrared spectra of the nine types of plastic and the selection of characteristic bands (the shaded areas are the selected characteristic bands).
To further enhance the diversity of the spectral data, two methods were used to expand the data: first, using a variational autoencoder (VAE) to expand the spectra of each type of plastic to 1000 spectra on the basis of the original dataset DA, forming a large-sample dataset DB of 9000 spectra in total; second, to simulate the noise interference introduced by sample movement, changes in instrument state and environmental conditions during online detection or on-site identification, Gaussian noise, impulse noise and background noise were superimposed on DA to construct a noisy spectral dataset DC of 8 subsets (DC1–DC8) with signal-to-noise ratios of 35–70 dB. Among these, DC3 (signal-to-noise ratio 45 dB) was used as a representative noisy subset for principal component analysis and model evaluation.
Principal component analysis (PCA) was performed on the three normalized spectral datasets (DA, DB, DC3). The cumulative explained variance of the first 3 principal components all exceeded 75%, effectively capturing the main trends of variation in the data; in the principal component score space, different types of plastics formed clear clusters. The clustering of the large-sample dataset DB was tighter than that of DA, indicating that the VAE-generated data enriched the data diversity while maintaining consistency with the original data distribution; while the loading curves of the noisy subset DC3 showed obvious periodic fluctuations, with the loading amplitude of the first principal component decreasing and the loading amplitude of the second principal component increasing, indicating that noise interfered with the principal component extraction and amplified the variation of secondary features — this also explains why model discrimination becomes more difficult in noisy environments.
Following the two principles of “including proven-effective algorithms” and “including cost-effective potential algorithms,” an evaluation framework containing 9 classification algorithms was established: linear discriminant analysis (LDA), partial least squares discriminant analysis (PLS-DA), support vector machine (SVM), K-nearest neighbors (KNN), random forest (RF), backpropagation neural network (BPNN), extreme learning machine (ELM), shallow one-dimensional convolutional neural network (SCNN1D) and deep one-dimensional convolutional neural network (DCNN1D). The main parameter settings were: PLS-DA with 15 latent variables; RF with 50 decision trees; SVM with a radial basis function kernel (penalty factor 10, kernel parameter 0.01); BPNN as a single hidden layer with 15 neurons; and ELM with 200 hidden-layer nodes.
The dataset was divided into a training set and an independent test set by 4:1 stratified sampling, and the training set was then optimized for parameters via five-fold cross-validation. Accuracy, precision, recall and F1 score were used as evaluation metrics, and all metrics were taken as the average of 5 independent runs; the training time and prediction time were also recorded, comprehensively evaluating the models from the three dimensions of classification performance, real-time performance and training cost.
To enhance the models’ noise resistance, discrete wavelet transform (DWT) was used for spectral feature extraction. The db2 wavelet basis was selected for one-dimensional nine-level decomposition of the infrared spectra; analysis found that when noise is low, the main effective information is concentrated in the middle layers, and as noise increases, the effective information gradually moves toward higher layers but is always concentrated in the middle-to-later layer region. Accordingly, the sum of the detail coefficients of layers 5 to 7 was taken as the spectral feature signal (denoted as S), and S was used as the input variable to construct the DWT-models.
The discrimination accuracies of the nine chemometric methods on the independent test sets of the original dataset DA, the large-sample dataset DB and the noisy subset DC3 are shown in the figure below.
Figure 5. Discrimination accuracies of the nine chemometric methods on the independent test sets of the three datasets (DA, DB, DC3).
Overall, almost all models performed best on the large-sample dataset DB and worst on the noisy subset DC3, consistent with the general rule that “the richer the training data, the better the model performance, and the introduction of noise reduces classification ability.” The SCNN1D model proposed in this study achieved 100% overall discrimination accuracy on both the DA and DB datasets; DCNN1D, due to its large number of parameters, reached 100% only on the large-sample dataset DB, but has stronger noise resistance; PLS-DA, BPNN and DCNN1D all achieved overall discrimination accuracies above 99% on the three datasets. In terms of prediction time, PLS-DA can maintain a short prediction time even on large datasets thanks to dimensionality-reduction techniques, and the prediction efficiency of BPNN and ELM is likewise outstanding; CNN-type models take longer to train, but the training cost of SCNN1D is significantly lower than that of DCNN1D.
After introducing DWT feature extraction, model performance improved significantly: DWT-PLS-DA, DWT-SCNN1D and DWT-DCNN1D all achieved 100% overall discrimination accuracy on the three datasets. Further generalization-ability validation (modeling on the DA training set and discriminating on the noisy subset DC1–DC8 test sets) gave the results in the table below:
| DWT-Model | Dataset | DC1 | DC2 | DC3 | DC4 | DC5 | DC6 | DC7 | DC8 |
|---|---|---|---|---|---|---|---|---|---|
| DWT-PLS-DA | Training set | 100 | 100 | 100 | 100 | 100 | 100 | 100 | 100 |
| DWT-PLS-DA | Test set | 99.28 | 99.28 | 100 | 100 | 100 | 100 | 100 | 100 |
| DWT-SCNN1D | Test set | 68.49 | 86.04 | 96.83 | 98.13 | 98.27 | 98.42 | 98.56 | 98.42 |
| DWT-DCNN1D | Test set | 66.04 | 81.01 | 85.76 | 88.20 | 87.48 | 87.19 | 87.91 | 86.91 |
It can be seen that the DWT-PLS-DA model is particularly outstanding: it achieved 100% overall discrimination accuracy on the DC3–DC8 noisy subsets, and still maintained about 99.3% accuracy even on DC1 and DC2 (signal-to-noise ratios 35 and 40 dB), which were severely disturbed by noise, demonstrating excellent generalization ability and robustness in noisy environments.
In view of the practical limitation of the narrow spectral range of MIR-HSI cameras, the performance of the three DWT-models was further evaluated on two narrow bands, MWIR (4000–2000 cm-1) and LWIR (1350–715 cm-1):
| Band | DWT-Model | Training Accuracy/% | Test Accuracy/% | Cross-Validation Accuracy/% |
|---|---|---|---|---|
| MWIR | DWT-PLS-DA | 83.90 | 78.42 | 76.20 |
| MWIR | DWT-SCNN1D | 95.92 | 86.62 | 85.67 |
| MWIR | DWT-DCNN1D | 100 | 88.34 | 86.58 |
| LWIR | DWT-PLS-DA | 98.03 | 95.68 | 81.98 |
| LWIR | DWT-SCNN1D | 100 | 99.42 | 99.12 |
| LWIR | DWT-DCNN1D | 100 | 99.28 | 99.10 |
The results show that the three models performed significantly better in the LWIR band than in the MWIR band: DWT-SCNN1D and DWT-DCNN1D achieved classification accuracies exceeding 99% in the LWIR band. In the MWIR band, although performance declined, each model still maintained strong discrimination ability for PE, PA, PS and PP, among which DWT-PLS-DA and DWT-SCNN1D achieved 100% discrimination accuracy for PE, PA and PP.
The confusion matrices for the LWIR band are shown in the figure below, with misclassifications mainly concentrated between ABS and PS.
Figure 6. LWIR-band confusion matrices: (a) DWT-PLS-DA; (b) DWT-SCNN1D.
Model interpretability analysis provided a basis for feature selection. The regression coefficient and VIP score analysis of the PLS-DA model shows that C–H bending vibrations (–CH2–, –CH3 and aromatic rings), C=O stretching vibration, C–H stretching vibration, aromatic ring C=C stretching vibration and C–Cl stretching vibration are the key features that distinguish different plastics; the VIP scores reached peaks in the regions 637–776 cm-1 and 1682–1742 cm-1, indicating that aromatic C–H bending vibration and C=O stretching vibration contributed particularly prominently to the discrimination by DWT-PLS-DA. Grad-CAM heat-map analysis shows that the key bands of DWT-SCNN1D are concentrated at 625–778, 1421–1509 and 1653–1810 cm-1, while DWT-DCNN1D makes more use of the broader potential spectral information within the range 550–1380 cm-1. These results can provide scientific guidance for the spectral band selection, design and optimization of hyperspectral cameras for waste plastic identification.
The efficient identification and sorting of waste plastics is a key link in the plastic recycling industry chain. This case shows that laboratory-grade ATR-FTIR combined with chemometric models can achieve rapid and accurate identification of nine common plastics (including complex samples that are dark-colored, aged or additive-containing) without destroying the samples and without complex sample preparation.
More importantly, this study provides methodological support for the implementation of MIR-HSI online sorting technology: on the one hand, DWT feature extraction significantly improved the robustness of the models in noisy environments, providing a solution to spectral quality fluctuations in on-site and online detection; on the other hand, the systematic evaluation and interpretability analysis of the models on the narrow LWIR/MWIR bands directly responds to the current hardware bottleneck of the limited spectral range of hyperspectral cameras, providing a basis for dedicated band selection and equipment optimization.
In terms of model selection, this study gives practical recommendations for different application scenarios: if the identification need is limited to PE, PA and PP and relies only on MWIR instruments, DWT-PLS-DA is the optimal choice; in the LWIR band, DWT-SCNN1D performs better. Both have relatively low hardware requirements and are more suitable for portable device development than DCNN1D, and are expected to drive low-cost, high-efficiency on-site identification equipment toward practical application.
ATR testing relies on close contact between the sample and the crystal surface, and residue on the crystal surface will directly contaminate the background and sample spectra. Before and after each measurement, the crystal surface should be cleaned with dust-free wiping paper (with a small amount of a suitable solvent if necessary), and the background or the next sample should be collected only after confirming that no residue remains.
The ATR signal strength depends on the quality of contact between the sample and the crystal. During measurement, press evenly with the matching press tip and rotate two turns so that the sample adheres closely to the crystal; for film-type samples (thickness about 0.01–0.25 mm), 3–4 layers may be folded to increase the effective contact area. Insufficient pressure will lead to weak signals and a decreased signal-to-noise ratio, but excessive force may damage the crystal or crush the sample, so it must be adjusted appropriately according to the sample form.
Waste plastic samples often carry dust, oil stains and other contaminants on their surfaces, which introduce interfering peaks. Before measurement, the sample surface should be wiped with anhydrous ethanol and air-dried at room temperature for about 2 minutes before being loaded onto the instrument.
Waste plastic samples have complex sources, and color, additives and degree of aging all change the spectral features. Before modeling, samples of different sources, colors, forms and degrees of aging should be covered as much as possible; otherwise the applicable scope of the model will be significantly limited. For samples of unknown type, confirmation may be made by combining recycling marks, manual spectral comparison and public spectral libraries (such as www.openspecy.org).
When oriented toward hyperspectral applications, the narrow LWIR/MWIR bands will lose some key features (such as the C=O stretching vibration). During modeling, interpretability analyses such as regression coefficients, VIP scores and Grad-CAM should be combined to confirm whether the key features are covered, and then a decision can be made on whether the chosen combination of bands and model is feasible.
In this case, the FOLI10 equipped with a diamond ATR accessory undertook the task of acquiring all 698 samples and four source spectra. The ATR accessory eliminates cumbersome sample-preparation steps such as pellet pressing, and waste plastic samples in different forms such as films, granules, fragments, fibers and powders can all be measured directly, greatly improving the efficiency of database building; the wide scanning range of 4000–550 cm-1 fully covers the two characteristic bands for plastic identification, and the 4 cm-1 resolution and 16 scans provide a high-quality spectral data foundation for the subsequent chemometric analysis.
The high-quality spectral signals were the prerequisite for this study to carry out systematic comparisons and innovations at the algorithm level: it is precisely on the basis of laboratory spectra with a good signal-to-noise ratio and complete band coverage that the researchers could construct a richly layered expanded dataset through VAE and simulated noise, thereby objectively evaluating the performance of the nine models at different noise levels and extrapolating the conclusions to the MIR-HSI online sorting scenario with limited spectral quality.
The key to obtaining reliable results in actual operation may not necessarily lie in complex instrument parameter settings, but in strict control of basic experimental details — such as whether the crystal is clean, whether the sample contacts the crystal closely, whether the background is collected in time, and whether the sample set is sufficiently diverse. Once these details are well controlled, the FOLI10 can be further extended from a routine structural identification tool into an effective platform for data acquisition and method development in the fields of waste plastic recycling and regulation.
This case used the INSA Optics FOLI10 FT-IR spectrometer (equipped with a diamond ATR accessory) to collect the mid-infrared spectra of 698 waste plastic samples of 9 types from 4 sources, established a systematic MIR spectral database, and constructed a chemometric evaluation framework containing 9 algorithms.
By expanding the data with VAE and simulated noise, and introducing DWT feature extraction, the DWT-PLS-DA model demonstrated excellent robustness and generalization ability on the noisy subsets (100% accuracy on the DC3–DC8 test sets, and still about 99.3% under severe noise); DWT-SCNN1D and DWT-DCNN1D achieved classification accuracies above 99% for the nine types of plastic in the LWIR band; DWT-PLS-DA and DWT-SCNN1D achieved 100% discrimination accuracy for PE, PA and PP in the MWIR band.
This case shows that the high-quality ATR-FTIR spectra collected by the FOLI10, combined with chemometric methods, can not only achieve rapid and accurate identification of waste plastics under laboratory conditions, but also provide a practical and feasible technical path for band selection, model selection and portable development of MIR-HSI online sorting equipment.
[1] Yang, J.; Xu, Y.-P.; Chu, X.-L. Application of mid-infrared spectroscopy in plastic waste discrimination: chemometric methods and exploration of their potential in hyperspectral applications. Measurement, 2026, 257, 118657. DOI:10.1016/j.measurement.2025.118657.


When you visit any website, it may store or retrieve information on your browser, mostly in the form of cookies. This information might be about you, your preferences or your device and is mostly used to make the site work as you expect it to. The information does not usually directly identify you, but it can give you a more personalized web experience. Because we respect your right to privacy, you can choose not to allow some types of cookies. Click on the different category headings to find out more and change our default settings. However, blocking some types of cookies may impact your experience of the site and the services we are able to offer.